10 Shocking Realities of How the U.S. Wealth Jackpot Is Actually Hidden
America holds more than $163 trillion in household wealth. The figure is so large that it becomes hard to fully grasp. But that wealth is far from evenly shared. Much of it sits in stock portfolios, real estate, and financial assets concentrated among a relatively small group of people, while a large share of the population experiences a very different reality. The contrast between the headline numbers and everyday life is striking, and it raises uncomfortable questions about how that wealth is actually distributed.
The Bottom Half Splits a Crumb

Credit: Canva
The wealthiest half of American families owns approximately 97.5% of the nation’s wealth, leaving the bottom half with just 2.5%. That figure for the bottom half represents roughly 67.7 million households as of Q3 2025, all of which share about $4 trillion. Meanwhile, the top 0.1% boosted their wealth by 40% in three years, twice the rate of gain managed by the bottom 90% combined.
The 1% Just Set a New Record

Credit: Getty Images
The top 1% of U.S. households owned 31.7% of all wealth in Q3 2025, the highest share recorded since the Federal Reserve began tracking in 1989. The dollar figure is equally striking: Americans owned $55 trillion in assets, approximately equal to the combined wealth of the bottom 90% of Americans. The top 10% of households control more than 87% of all corporate equity and mutual fund shares.
Trillions Are Hiding Offshore

Credit: Getty Images
A study by the IRS and university researchers found that about 1.5 million U.S. taxpayers hold about $4 trillion in foreign accounts, with about half parked in tax havens like Switzerland and the Cayman Islands. The habit concentrates sharply at the top, where the wealthy hold a portion of all U.S. assets stashed in offshore accounts, often through a web of shell companies.
Boomers Own Half of Everything

Credit: Getty Images
Baby boomers hold a striking share of America’s wealth. As of late 2025, they control just over 51% of total U.S. household wealth, even though they make up only about 20% of the population, which amounts to roughly $85 trillion in assets. Millennials, who make up a similar share of the population, hold around $18 trillion. The gap is largely explained by timing: boomers entered the housing market earlier, bought when prices were lower, benefited from decades of falling interest rates, and saw long-term stock market gains build over time.
The “Buy, Borrow, Die” Trick Costs the Treasury Billions

Credit: Getty Images
The “Buy, Borrow, Die” strategy is used by the ultra-wealthy, who buy appreciating assets like stocks or real estate, then borrow against them at low interest rates rather than sell. At death, those assets pass to heirs, and a rule called stepped-up basis wipes out most accumulated gains. As a result, unrealized profits often avoid taxation, and the Joint Committee on Taxation estimates this costs the federal government about $72.5 billion in lost revenue in 2026.
The $5.5 Trillion Shadow System Nobody Has to Report

Credit: Getty Images
Family offices that manage investments for a single ultra-wealthy family operate largely outside public view. Deloitte estimates that wealth managed through family offices has reached about $5.5 trillion, up from $3.3 trillion in 2019. Because of an exemption under the Dodd-Frank Act, these offices are not required to register with the SEC under the Investment Advisers Act, which means they face far less public disclosure than standard investment advisers.
Capital Gains Get a Sweeter Deal Than Wages

Credit: charliepix
The tax code treats a paycheck and an investment profit very differently. The highest federal rate on earned income is 37%, but taxes on profits from selling stocks held for over a year are up to 20%. Since the ultra-wealthy earn most of their income through investments, that gap is valuable to them. According to Gallup, 87% of adults in households earning $100,000 or more own stocks, meaning this tax benefit favors the wealthy.
The Top 0.1% Grew Its Slice by Nearly 60% Since 1989
Credit: pexels
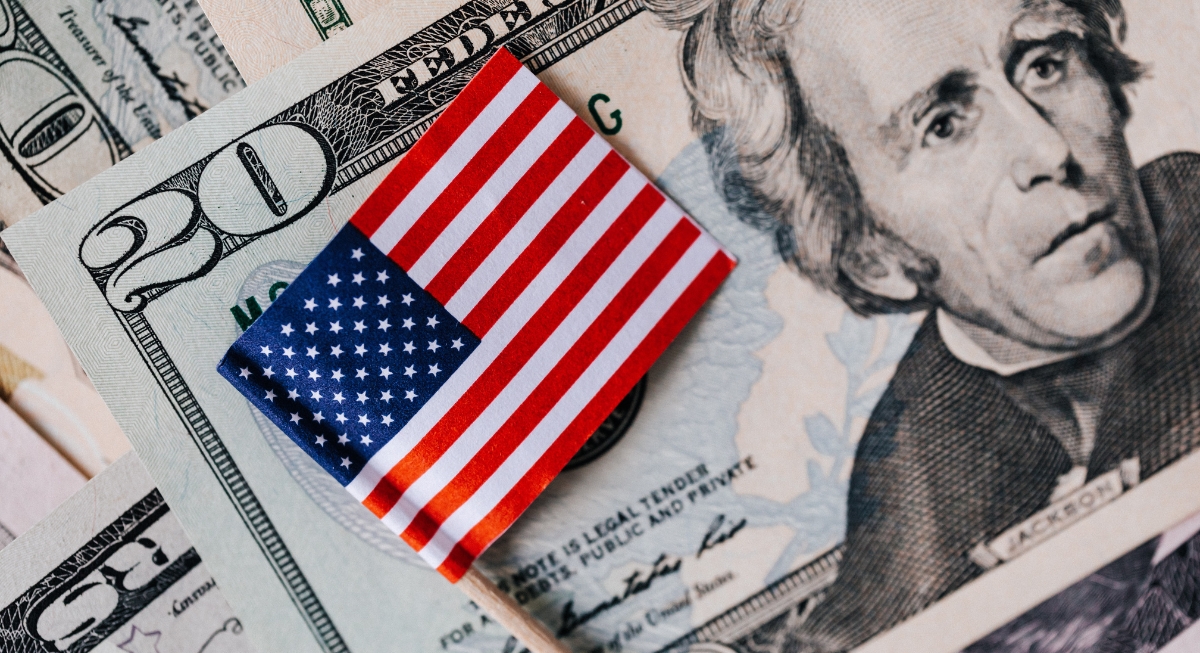
The share of U.S. wealth owned by the top 0.1% grew by 59.6% from 1989 to 2024, according to an Institute for Policy Studies analysis of Federal Reserve data. Over the same stretch, the bottom 50%’s share fell by 26.1%. In 1989, there were 66 U.S. billionaires. By early 2026, that number had reached a record 989. Three and a half decades of compounding advantage are part of why that number grew that fast.
Millennials and Gen X Carry the Debt While Boomers Hold the Assets

Credit: Canva
Experian data show millennials averaged $132,280 in total debt in June 2025, compared with $92,619 for baby boomers, while Gen X carried the highest average debt at $158,105. Yet, college costs have risen sharply across generations, with 2025-26 published tuition and fees now at $11,950 for public four-year in-state students and $45,000 for private nonprofit four-year students. In 2025, the median age of first-time homebuyers hit a record 40, highlighting the growing struggle to afford necessities.
Older Americans Keep Gaining While Younger Ones Wait

Credit: pexels
Individuals aged 70 and above expanded their share of national wealth by 3.8 percentage points since 2020, holding 31.4% of total U.S. wealth by the end of 2024. Older households benefited most from rising stock prices, since investment returns are more durable than the pandemic-era transfers that temporarily lifted lower-income families. Meanwhile, Fed data show the bottom 50% held about $2.6 trillion in consumer credit in Q3 2025.